Partner visa numbers are often compared as though applications lodged, applications waiting and Migration Program outcomes measure the same thing. They do not. This briefing separates the latest figures published by the Australian Department of Home Affairs and explains what each one can—and cannot—tell you.
The figures side by side
| Measure | 2023–24 | 2024–25 | Reported change |
|---|---|---|---|
| Partner application lodgements | 65,160 | 68,105 | Up 4.5% |
| First-stage Partner applications on hand at 30 June | 75,060 | 96,839 | Up 29% |
| Partner category Migration Program outcome | Not used for this comparison | 40,500 | 77.1% of the Family stream outcome |
Source: Department of Home Affairs, 2024–25 Migration Program Report, page 12. Figures are reproduced as reported; percentages are the Department's reported changes.
What “lodgements” means
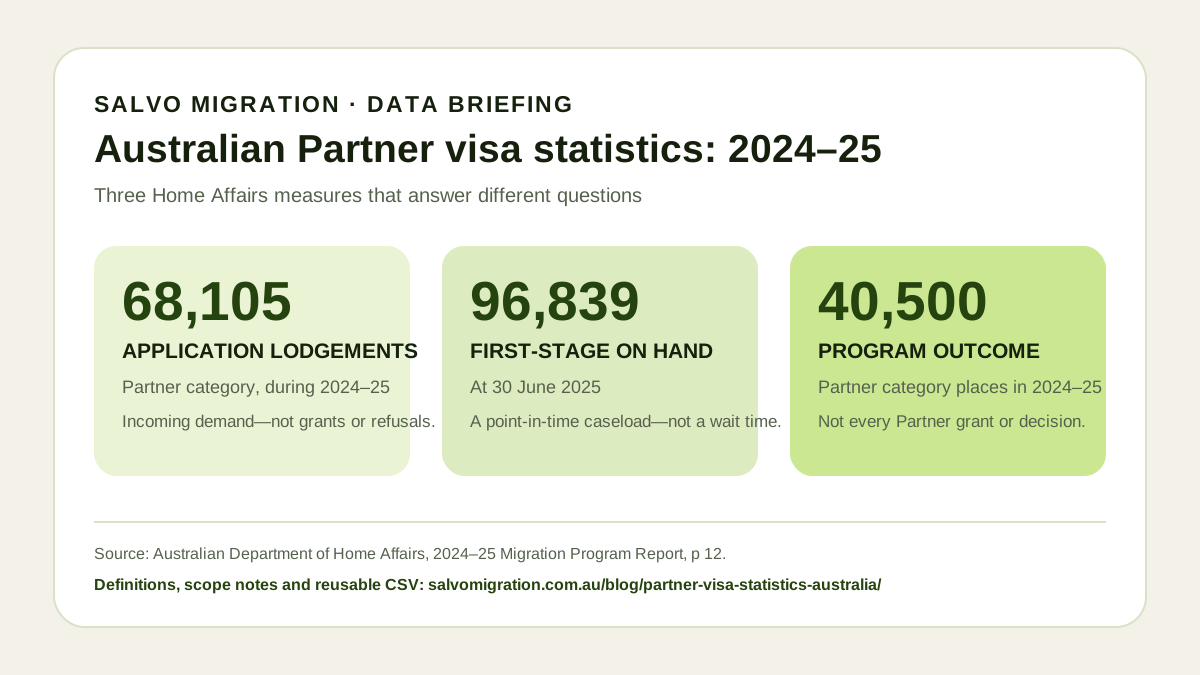
The 68,105 figure counts Partner application lodgements reported for 2024–25. It indicates incoming demand during the year. It is not a grant figure, a refusal figure or the number of individual couples who received a decision.
What “on hand” means
The 96,839 figure is a point-in-time count of first-stage Partner applications on hand at 30 June 2025. An on-hand application has not necessarily been waiting for the same period as another. The total cannot be converted into an individual partner visa processing-time estimate.
What the 40,500 program outcome means
The Partner category delivered 40,500 places in the 2024–25 Migration Program outcome. That was 77.1% of the Family stream's 52,500 places. Home Affairs also notes that permanent-stage Partner applications do not count toward Migration Program outcomes. The 40,500 number therefore should not be described as every Partner visa grant or every Partner decision made during the year.
What the data does not show
- It does not publish a partner visa approval or refusal rate.
- It does not predict the outcome of an individual application.
- It does not establish how long a current application will take.
- It does not separate every figure into the 820/801 onshore, 309/100 offshore and subclass 300 pathways in the report section used here.
Why the distinction matters
A rising on-hand caseload may reflect the relationship between new lodgements, processing capacity, case complexity and finalisations, but this report section does not isolate the cause. It would be misleading to convert the 29% increase into a claim that every application will take 29% longer.
For applicants, the practical task remains preparing the correct pathway and evidence for their circumstances. Start with the Australian partner visa overview, then use the relationship evidence guide and current official processing information.
Sources and reuse
Primary source: Department of Home Affairs, 2024–25 Migration Program Report.
Supporting dataset: Permanent Migration Program outcomes snapshot.
Reusable extract: Download the source-labelled CSV, including the measure definitions and methodology cautions used in this briefing.
You may cite this briefing with a link to this page. When reproducing the underlying government data, check and comply with the source licence and attribute the Department of Home Affairs.